# 一、本文介绍
本文给大家带来的是 YOLOv8 系列的绘图功能,我将向大家介绍 YOLO 系列的绘图功能。我们在进行实验时,经常需要比较多个结果,针对这一问题,我写了点代码来解决这个问题,它可以根据训练结果绘制损失 (loss) 和 mAP(平均精度均值)的对比图。这个工具不仅支持多个文件的对比分析,还允许大家在现有代码的基础上进行修,从而达到数据可视化的功能,大家也可以将对比图来放在论文中进行对比也是非常不错的选择。
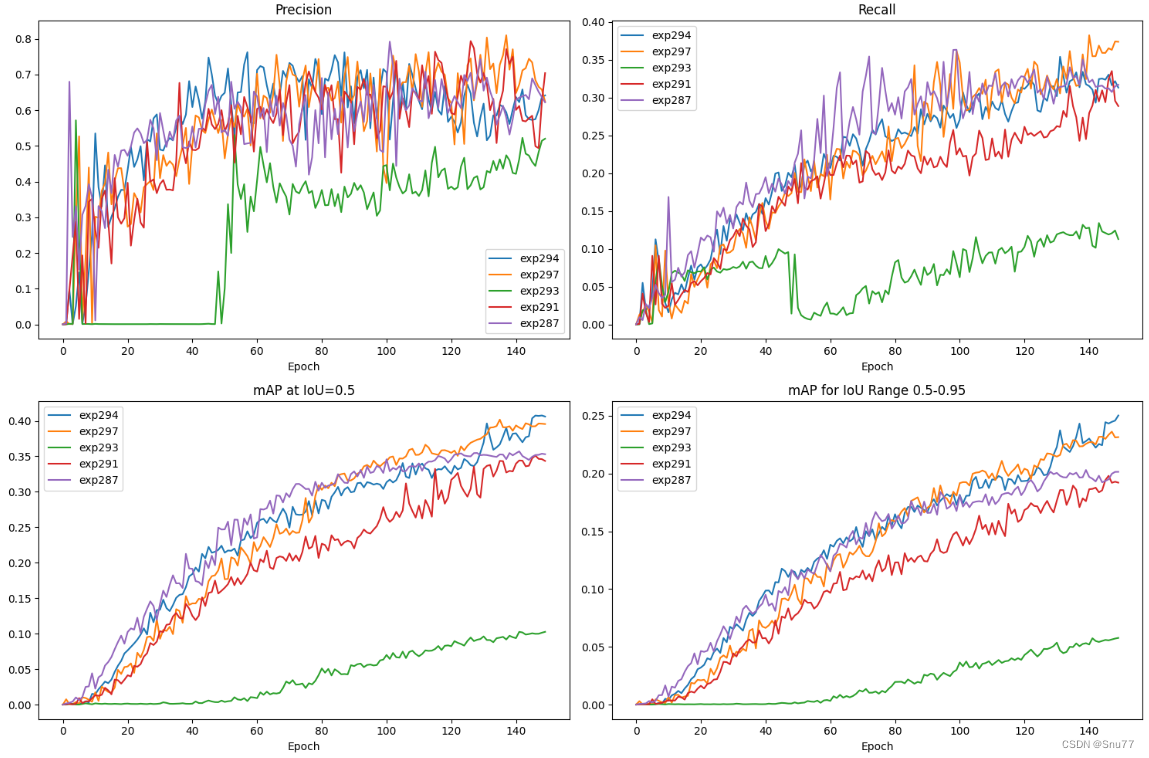
先展示一下效果图 ->
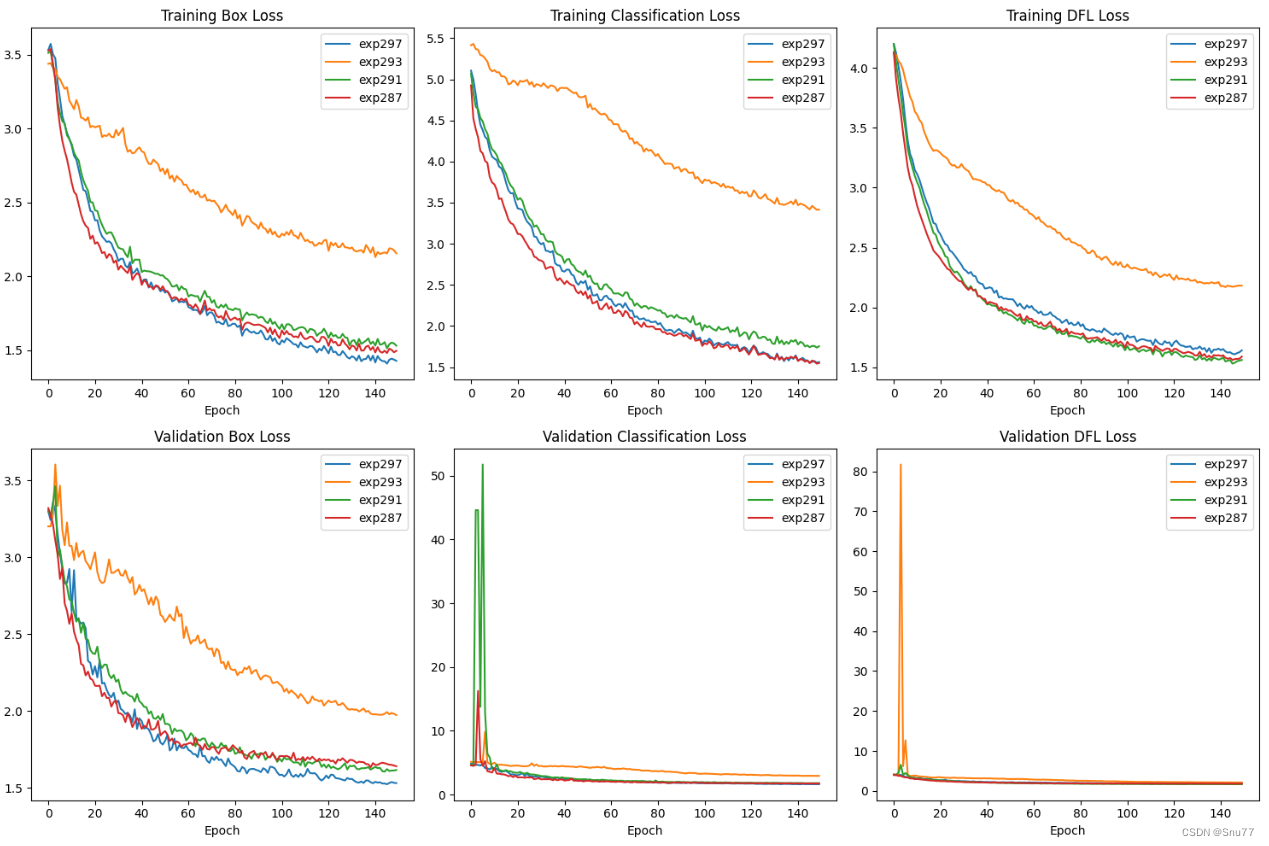
损失对比图象 ->
# 二、绘图工具核心代码
import os | |
import pandas as pd | |
import matplotlib.pyplot as plt | |
def plot_metrics_and_loss(experiment_names, metrics_info, loss_info, metrics_subplot_layout, loss_subplot_layout, | |
metrics_figure_size=(15, 10), loss_figure_size=(15, 10), base_directory='runs/train'): | |
# Plot metrics | |
plt.figure(figsize=metrics_figure_size) | |
for i, (metric_name, title) in enumerate(metrics_info): | |
plt.subplot(*metrics_subplot_layout, i + 1) | |
for name in experiment_names: | |
file_path = os.path.join(base_directory, name, 'results.csv') | |
data = pd.read_csv(file_path) | |
column_name = [col for col in data.columns if col.strip() == metric_name][0] | |
plt.plot(data[column_name], label=name) | |
plt.xlabel('Epoch') | |
plt.title(title) | |
plt.legend() | |
plt.tight_layout() | |
metrics_filename = 'metrics_curves.png' | |
plt.savefig(metrics_filename) | |
plt.show() | |
# Plot loss | |
plt.figure(figsize=loss_figure_size) | |
for i, (loss_name, title) in enumerate(loss_info): | |
plt.subplot(*loss_subplot_layout, i + 1) | |
for name in experiment_names: | |
file_path = os.path.join(base_directory, name, 'results.csv') | |
data = pd.read_csv(file_path) | |
column_name = [col for col in data.columns if col.strip() == loss_name][0] | |
plt.plot(data[column_name], label=name) | |
plt.xlabel('Epoch') | |
plt.title(title) | |
plt.legend() | |
plt.tight_layout() | |
loss_filename = 'loss_curves.png' | |
plt.savefig(loss_filename) | |
plt.show() | |
return metrics_filename, loss_filename | |
# Metrics to plot | |
metrics_info = [ | |
('metrics/precision(B)', 'Precision'), | |
('metrics/recall(B)', 'Recall'), | |
('metrics/mAP50(B)', 'mAP at IoU=0.5'), | |
('metrics/mAP50-95(B)', 'mAP for IoU Range 0.5-0.95') | |
] | |
# Loss to plot | |
loss_info = [ | |
('train/box_loss', 'Training Box Loss'), | |
('train/cls_loss', 'Training Classification Loss'), | |
('train/dfl_loss', 'Training DFL Loss'), | |
('val/box_loss', 'Validation Box Loss'), | |
('val/cls_loss', 'Validation Classification Loss'), | |
('val/dfl_loss', 'Validation DFL Loss') | |
] | |
# Plot the metrics and loss from multiple experiments | |
metrics_filename, loss_filename = plot_metrics_and_loss( | |
experiment_names=['exp294', 'exp297', 'exp293', 'exp291', 'exp287'], | |
metrics_info=metrics_info, | |
loss_info=loss_info, | |
metrics_subplot_layout=(2, 2), | |
loss_subplot_layout=(2, 3) | |
) |
# 三、使用讲解
使用方式非常简单,我们首先创建一个文件,将核心代码粘贴进去,其中 experiment_names 这个参数就代表我们的每个训练结果的名字, 我们只需要修改这个即可,我这里就是五个结果进行对比,修改完成之后大家运行该文件即可。
# 五、热力图代码
使用方式我会单独更一篇,这个热力图代码的进阶版,这里只是先放一下。
import warnings | |
warnings.filterwarnings('ignore') | |
warnings.simplefilter('ignore') | |
import torch, yaml, cv2, os, shutil | |
import numpy as np | |
np.random.seed(0) | |
import matplotlib.pyplot as plt | |
from tqdm import trange | |
from PIL import Image | |
from ultralytics.nn.tasks import DetectionModel as Model | |
from ultralytics.utils.torch_utils import intersect_dicts | |
from ultralytics.utils.ops import xywh2xyxy | |
from pytorch_grad_cam import GradCAMPlusPlus, GradCAM, XGradCAM | |
from pytorch_grad_cam.utils.image import show_cam_on_image | |
from pytorch_grad_cam.activations_and_gradients import ActivationsAndGradients | |
def letterbox(im, new_shape=(640, 640), color=(114, 114, 114), auto=True, scaleFill=False, scaleup=True, stride=32): | |
# Resize and pad image while meeting stride-multiple constraints | |
shape = im.shape[:2] # current shape [height, width] | |
if isinstance(new_shape, int): | |
new_shape = (new_shape, new_shape) | |
# Scale ratio (new / old) | |
r = min(new_shape[0] / shape[0], new_shape[1] / shape[1]) | |
if not scaleup: # only scale down, do not scale up (for better val mAP) | |
r = min(r, 1.0) | |
# Compute padding | |
ratio = r, r # width, height ratios | |
new_unpad = int(round(shape[1] * r)), int(round(shape[0] * r)) | |
dw, dh = new_shape[1] - new_unpad[0], new_shape[0] - new_unpad[1] # wh padding | |
if auto: # minimum rectangle | |
dw, dh = np.mod(dw, stride), np.mod(dh, stride) # wh padding | |
elif scaleFill: # stretch | |
dw, dh = 0.0, 0.0 | |
new_unpad = (new_shape[1], new_shape[0]) | |
ratio = new_shape[1] / shape[1], new_shape[0] / shape[0] # width, height ratios | |
dw /= 2 # divide padding into 2 sides | |
dh /= 2 | |
if shape[::-1] != new_unpad: # resize | |
im = cv2.resize(im, new_unpad, interpolation=cv2.INTER_LINEAR) | |
top, bottom = int(round(dh - 0.1)), int(round(dh + 0.1)) | |
left, right = int(round(dw - 0.1)), int(round(dw + 0.1)) | |
im = cv2.copyMakeBorder(im, top, bottom, left, right, cv2.BORDER_CONSTANT, value=color) # add border | |
return im, ratio, (dw, dh) | |
class yolov8_heatmap: | |
def __init__(self, weight, cfg, device, method, layer, backward_type, conf_threshold, ratio): | |
device = torch.device(device) | |
ckpt = torch.load(weight) | |
model_names = ckpt['model'].names | |
csd = ckpt['model'].float().state_dict() # checkpoint state_dict as FP32 | |
model = Model(cfg, ch=3, nc=len(model_names)).to(device) | |
csd = intersect_dicts(csd, model.state_dict(), exclude=['anchor']) # intersect | |
model.load_state_dict(csd, strict=False) # load | |
model.eval() | |
print(f'Transferred {len(csd)}/{len(model.state_dict())} items') | |
target_layers = [eval(layer)] | |
method = eval(method) | |
colors = np.random.uniform(0, 255, size=(len(model_names), 3)).astype(np.int) | |
self.__dict__.update(locals()) | |
def post_process(self, result): | |
logits_ = result[:, 4:] | |
boxes_ = result[:, :4] | |
sorted, indices = torch.sort(logits_.max(1)[0], descending=True) | |
return torch.transpose(logits_[0], dim0=0, dim1=1)[indices[0]], torch.transpose(boxes_[0], dim0=0, dim1=1)[indices[0]], xywh2xyxy(torch.transpose(boxes_[0], dim0=0, dim1=1)[indices[0]]).cpu().detach().numpy() | |
def draw_detections(self, box, color, name, img): | |
xmin, ymin, xmax, ymax = list(map(int, list(box))) | |
cv2.rectangle(img, (xmin, ymin), (xmax, ymax), tuple(int(x) for x in color), 2) | |
cv2.putText(img, str(name), (xmin, ymin - 5), cv2.FONT_HERSHEY_SIMPLEX, 0.8, tuple(int(x) for x in color), 2, lineType=cv2.LINE_AA) | |
return img | |
def __call__(self, img_path, save_path): | |
# remove dir if exist | |
if os.path.exists(save_path): | |
shutil.rmtree(save_path) | |
# make dir if not exist | |
os.makedirs(save_path, exist_ok=True) | |
# img process | |
img = cv2.imread(img_path) | |
img = letterbox(img)[0] | |
img = cv2.cvtColor(img, cv2.COLOR_BGR2RGB) | |
img = np.float32(img) / 255.0 | |
tensor = torch.from_numpy(np.transpose(img, axes=[2, 0, 1])).unsqueeze(0).to(self.device) | |
# init ActivationsAndGradients | |
grads = ActivationsAndGradients(self.model, self.target_layers, reshape_transform=None) | |
# get ActivationsAndResult | |
result = grads(tensor) | |
activations = grads.activations[0].cpu().detach().numpy() | |
# postprocess to yolo output | |
post_result, pre_post_boxes, post_boxes = self.post_process(result[0]) | |
for i in trange(int(post_result.size(0) * self.ratio)): | |
if float(post_result[i].max()) < self.conf_threshold: | |
break | |
self.model.zero_grad() | |
# get max probability for this prediction | |
if self.backward_type == 'class' or self.backward_type == 'all': | |
score = post_result[i].max() | |
score.backward(retain_graph=True) | |
if self.backward_type == 'box' or self.backward_type == 'all': | |
for j in range(4): | |
score = pre_post_boxes[i, j] | |
score.backward(retain_graph=True) | |
# process heatmap | |
if self.backward_type == 'class': | |
gradients = grads.gradients[0] | |
elif self.backward_type == 'box': | |
gradients = grads.gradients[0] + grads.gradients[1] + grads.gradients[2] + grads.gradients[3] | |
else: | |
gradients = grads.gradients[0] + grads.gradients[1] + grads.gradients[2] + grads.gradients[3] + grads.gradients[4] | |
b, k, u, v = gradients.size() | |
weights = self.method.get_cam_weights(self.method, None, None, None, activations, gradients.detach().numpy()) | |
weights = weights.reshape((b, k, 1, 1)) | |
saliency_map = np.sum(weights * activations, axis=1) | |
saliency_map = np.squeeze(np.maximum(saliency_map, 0)) | |
saliency_map = cv2.resize(saliency_map, (tensor.size(3), tensor.size(2))) | |
saliency_map_min, saliency_map_max = saliency_map.min(), saliency_map.max() | |
if (saliency_map_max - saliency_map_min) == 0: | |
continue | |
saliency_map = (saliency_map - saliency_map_min) / (saliency_map_max - saliency_map_min) | |
# add heatmap and box to image | |
cam_image = show_cam_on_image(img.copy(), saliency_map, use_rgb=True) | |
cam_image = self.draw_detections(post_boxes[i], self.colors[int(post_result[i, :].argmax())], f'{self.model_names[int(post_result[i, :].argmax())]} {float(post_result[i].max()):.2f}', cam_image) | |
cam_image = Image.fromarray(cam_image) | |
cam_image.save(f'{save_path}/{i}.png') | |
def get_params(): | |
params = { | |
'weight': 'yolov8n.pt', | |
'cfg': 'ultralytics/cfg/models/v8/yolov8n.yaml', | |
'device': 'cuda:0', | |
'method': 'GradCAM', # GradCAMPlusPlus, GradCAM, XGradCAM | |
'layer': 'model.model[9]', | |
'backward_type': 'all', # class, box, all | |
'conf_threshold': 0.6, # 0.6 | |
'ratio': 0.02 # 0.02-0.1 | |
} | |
return params | |
if __name__ == '__main__': | |
model = yolov8_heatmap(**get_params()) | |
model(r'ultralytics/assets/bus.jpg', 'result') |